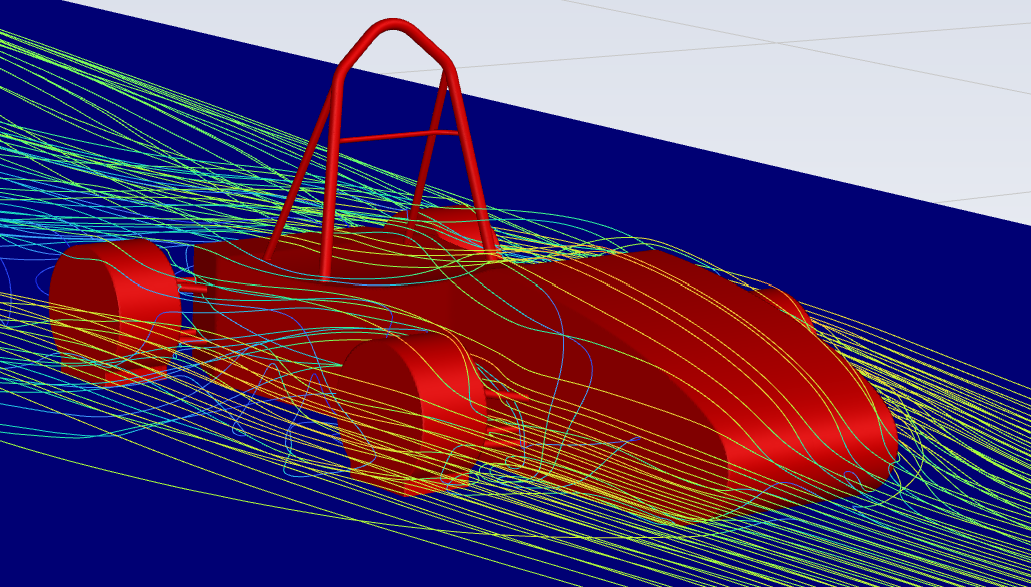
Pathlines plot
In this project, I attempted to analyze the effects of adding downforce producing elements to an FSAE car. Shown here is a simplified version of Columbia's 2023 EV car.
Analyzing the effects of adding Downforce producing devices to Columbia's FSAE car.
In this project, I attempted to analyze the effects of adding downforce producing elements to an FSAE car. Shown here is a simplified version of Columbia's 2023 EV car.

The first step is to understand what effect increasing downforce in the Fz direction will have on Lateral Load Transfer in the Fy direction. This plot is taken from Milliken's RCVD book.
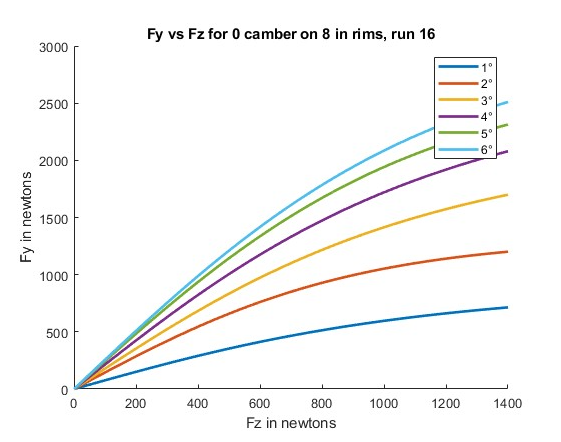
In this code, I plotted various tire slip angles to understand their Fz versus Fy relationship. I used the assumption that the highest Fz to Fy ratio was the best and that was at a tire slip angle of 6.
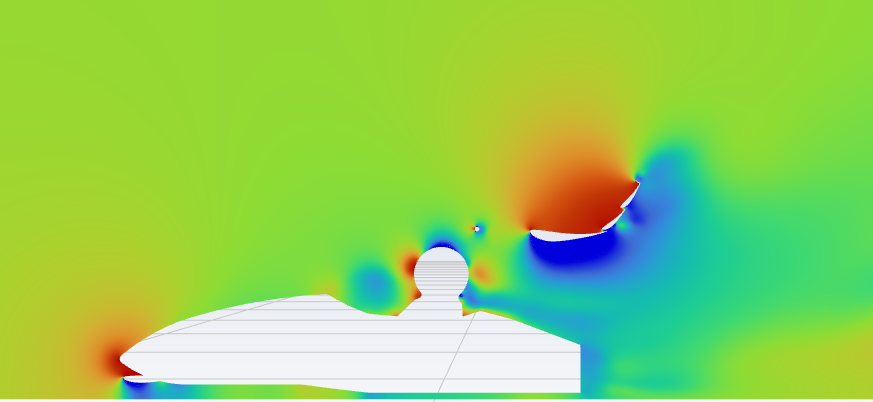
Next, I imported a full FSAE car with downforce producing devices into Ansys Fluent. The photo here is of the pressure contours of each individual part from a 2D prespective. Note, I learned how to do this CFD analysis on my own, I found this tutorial from Ansys helpful: ![]()
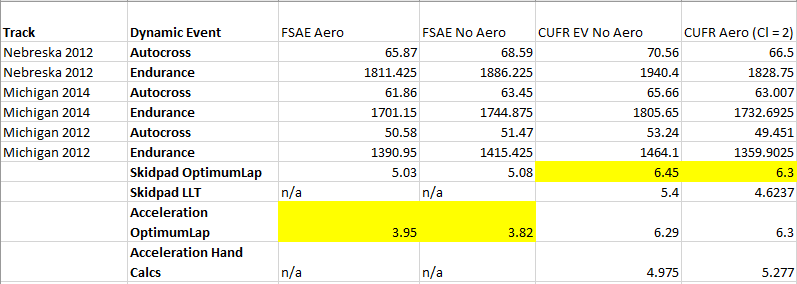
The following step was to run hand calculations to see if adding these downforce values to Columbia's FSAE car would show significant improved in lap times at each of the dynamic events. I used OptimumLaps pre-built FSAE tracks and previous competition scores to see if my results fell within a reasonable range of values. The yellow values are inregularities with the simulation and real world values.
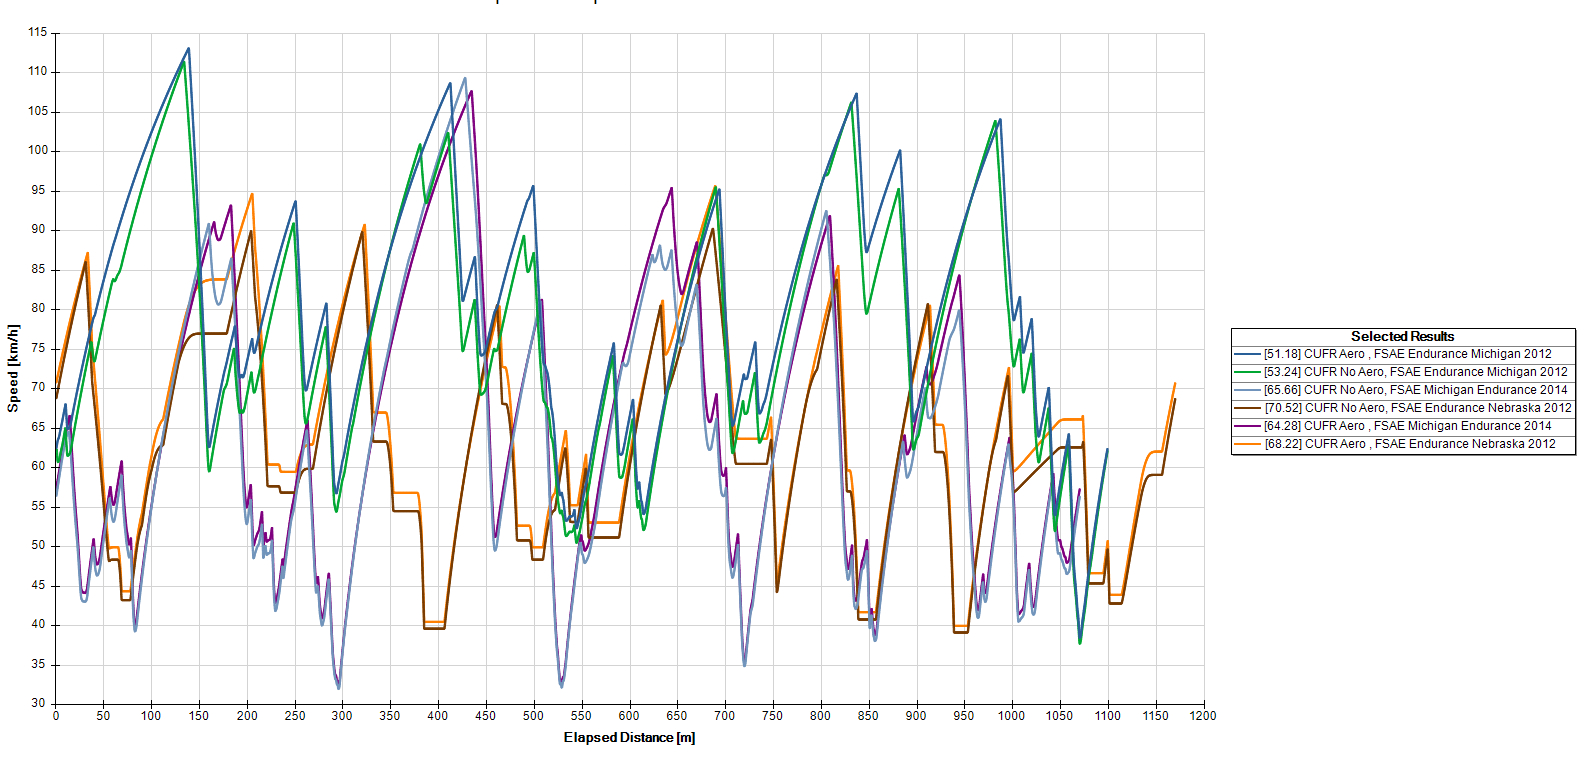
While this project had some major simplifications in terms of CAD model, analysis methods used, and software, it was a good step towards creating a frame work to understanding how to go about Aerodynamic Analysis. This plot shows that increasing downforce will speed up lap times. In future iterations, a more accurate CAD model, better simulation software, track testing, and wind tunnel testing would provide more accurate results. A paper I wrote on this project is shown here: 📄 .